Theoretical Background for Using Daktela V6
This document contains basic description of terminology and processes of standard contact center for the purpose of using Daktela V6. The following description is a theoretical base for individual system components design.
1. Basic Contact Centre Description
The basic objects relevant to the contact center operations are:
Agent – an employee or a cooperating person of the contact centre handling individual customer requests and directly communicating with the customer.
Customer – the person communicating with the contact centre remotely.
Channel – describes the means of contacting the contact centre by the customer. The channels are primarily phone call, web chat, SMS chat, email and others. In common terminology, the term “multichannel” describes a solution which can handle several channels at the same time. Along with this, the term “omnichannel” extends the term “multichannel” by integrating all channels into one logic. In practice, it’s important for the customer to have a consistent experience with contacting customer care for the contact centre to be “omnichannel”.
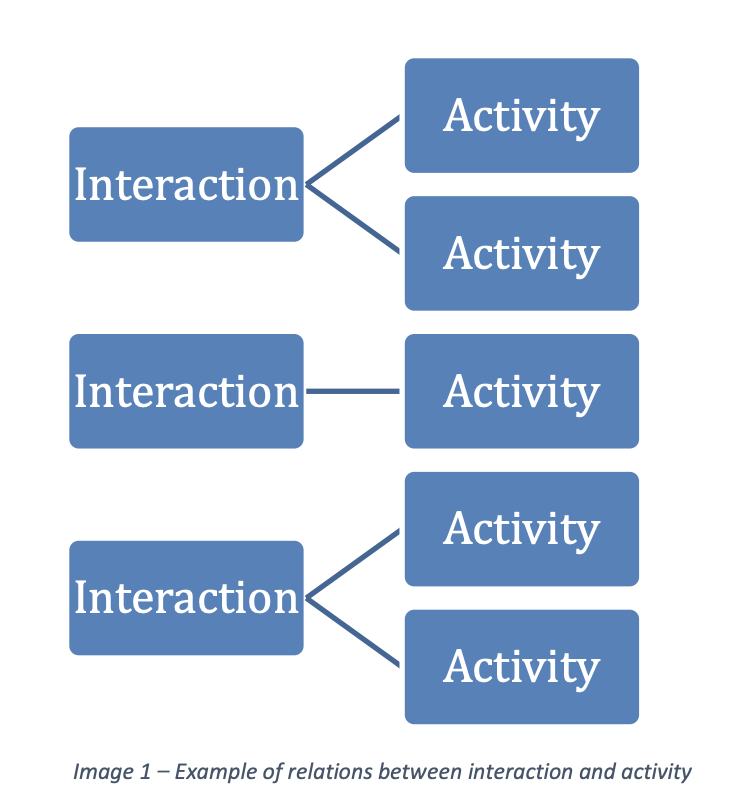
Interaction – describes the existence of one communication thread no matter the communication channel. One interaction may be one thread of a phone call, one thread of a web chat communication etc.
Activity – describes the real activity of an agent on a specific interaction, including work related to the interaction.
Processing – describes connecting of agent directly to the interaction. In common telephony terminology, this is also described as “channel”.
Queue – describes the direction or interaction group which is handled in the same way and by a single functional part of customer care.
During communication with the contact centre, interactions are usually divided according to the direction in which the communication flows. This division is often put into practice using separate contact centre departments since each direction usually requires a different agent skillset.
1.1. Outbound Interactions
Outbound traffic usually consists of telesales agents (telemarketing) or calling the customer base with some information. The calls usually include the following activities:
Cross-selling – selling another product to the current customer base.
Up-selling – promoting more expensive alternatives of currently used products or services.
Lead generation – during the interaction, the agent's task is to find potential for further customer processing.
For lead generation, the double touch method may be used. This method consists of dividing the sales process into two different agents (and two interactions). During the first one, the goal is to find potential for selling products to the customer – this is usually handled by generic contact centre agents. The second interaction is handled by specialised salesmen who usually try to sell a specific type of product.
Customer acquisition within outbound activities has several phases which may differ based on the goal of the specific campaign:
Prospect generation – the goal is to find potential for further sales activities without offering a specific product.
Lead generation – the goal is to offer a specific product and in case of interest, the contact is then handed over to the sales department or partner.
Contract closure – the goal is for the customer to sign a contract with the company.
As for telesales activities, campaigns are divided by lead quality:
Cold contacts – describes a contact base which has not yet been contacted. The answer rate is usually quite low, which requires technology able to handle a large volume of calls.
Warm contacts – describes a contact base which has gone through some acquisition processes but there has not been enough specific interest for the sale to be considered highly probable.
Hot leads – describes a contact base which has actively presented interest in the product and which usually has a high success rate as inn many cases, the goal is only to finalise some details of the sale. Nevertheless, many cases require extensive sales activity within the interaction.
Outbound campaign calling is implemented using one of the following types of dialling, usually using the dialler function:
Preview dialler – the contact is manually loaded, studied, manually dialled and entirely manually evaluated and saved.
Progressive dialler – automatic dialling where the campaign record is automatically presented to the agent to study before the call, after a certain delay the record is automatically dialled and in case of an unsuccessful connection automatically closed with the relevant evaluation. In case of a successful connection with the customer, the record has to be manually processed.
Predictive dialler – automatic dialling where the dialler automatically dials a certain number of calls per each agent based on their latest statistics. When the call is answered by the customer, it is automatically assigned to an available agent. This mode of dialling takes into account that less than 50% of the calls are actually answered.
1.2. Inbound Interactions
Inbound traffic is handled in ways that are in principle simple but can vary. The main approach involves the division of agents according to so-called skills which express the agent's ability to handle a certain traffic on a specific channel. In a typical contact centre, basically ranging from the smallest, an agent usually has a combination of several skills.
In inbound traffic, the individual skills are divided as follows:
By channel – an agent’s ability to maintain certain channels (web chats, calls, ...) is usually determined by their verbal ability.
By function – the client can contact the contact centre with different requirements which are usually divided into service (existing clients) and sales (new clients). These two main categories require different agent skills because, in the case of a service, the agent's main task is to look after the client, and in the case of a sale, the goal is to gain a new client, which requires sales skills.
By project – in the contact centre, several projects can be run in parallel with allocated agents.
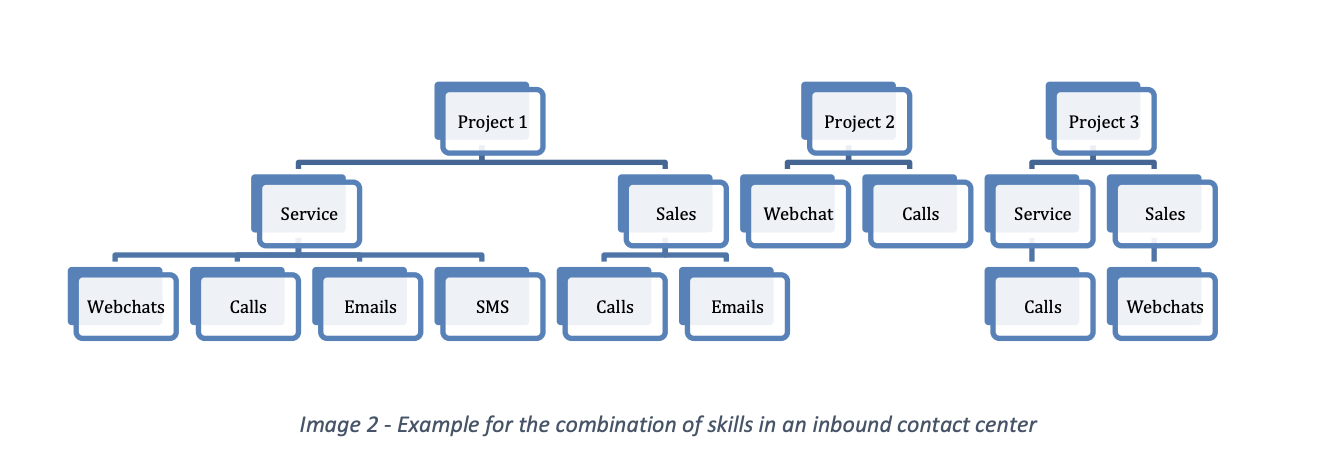
The skill set of a particular agent is always determined by a combination of the above-mentioned parameters. There are always several such combinations in a regular contact centre. In some cases, standardisation according to the role of the agent is possible. Sometimes the combination is strictly individual and each agent is unique in this regard.
If the situation requires several completely different skills, e.g. during several parallel projects distributed among the agents in various ways, this is called a multiskill environment, in practice often called skill-based routing. In more complex operations, competence routing may also be used. Competence routing prioritises agents according to their skill level, e.g. that new customers are primarily handled by senior salespeople and interactions are then directed to junior agents. If customer base segmentation is available, it is also common to direct key customers to senior agents.
1.2.1. Distribution Matrix
In a multichannel environment where agents have a multiskill combination of several communication channels, it is necessary to configure activity parallelisation by individual channel types. This is usually done using the distribution matrix tool. The matrix defines the relationship between the channels and the maximum number of activities that can be directed to the agent. The rows of the sample matrix below show the metric "Numbers of open activities". The metric "Accept new activity" is set in the columns of the matrix. The sample matrix looks like this:

The above matrix is interpreted as follows:
The agent can accept an incoming call if they have a maximum of 0 open calls, a maximum of 1 open web chat, a maximum of 2 open SMS chats and a maximum of 1 open Messenger chat.
The agent can accept an incoming web chat if they have a maximum of 1 open call, a maximum of 2 open web chats, a maximum of 1 open SMS chat and a maximum of 2 open Messenger chats.
The agent can accept an incoming SMS chat if they have a maximum of 1 open call, a maximum of 1 open web chat, a maximum of 1 open SMS chat and a maximum of 2 open Messenger chats.
The agent can accept an incoming Messenger chat if they have a maximum of 1 open call, a maximum of 2 open web chats, a maximum of 1 open SMS chat and a maximum of 1 open Messenger chat.
If the agent doesn't meet the above conditions then the call or web chat will not be routed to the agent and will continue on to the next step according to the distribution strategy.
1.3. Other Terminology
Further terms are listed in the following terminology table in alphabetical order:
Term | Definition |
|---|---|
Abandoned interaction (abandon) | An interaction that was abandoned (or hung up) by the customer before being picked up by the agent. |
Automated Speech Recognition (ASR) | A technology that enables customer service to be provided in an automated way using voice navigation. |
Blending | A method of work characterised by simultaneous operation of incoming and outgoing traffic. |
Busy Hour Call Attempts (BHCA) | A metric that expresses the maximum parallel load of the contact centre expressed as the number of interactions. It serves as the basis for the correct dimensioning of the application's performance resources. |
Callback | A processing activity in which the customer is called by the contact centre after an unsuccessful connection by the customer. |
Computer Telephony Integration (CTI) | The term for a solution integrated directly into the information systems that the agent uses in normal operations. It usually occurs in the form of a CTI bar or CTI panel. |
Co-browsing | A technological way of displaying the same information to the customer and the agent at the same time, especially in terms of web browsing. |
Customer Relationship Management (CRM) | A process approach and the term for an information system used to manage customer relationships. |
Erlang | A unit calculated as the number of hours of traffic per hour. |
Expected Wait Time (EWT) | The time the customer is expected to need to wait before being served by an agent when the customer initiates the interaction. |
First Call Resolution (FCR) | A case where the request is fully processed during the first interaction with the customer and there is no need for communication to resolve the request. |
Idle state | An agent status that indicates readiness to handle interactions but with no current active activities. |
Interactive Voice Response (IVR) | A voice-guided navigation system controlled by phone keypad or other input device. |
Key Performance Indicator (KPI) | A general name for a group of metrics that are used to make management decisions, evaluate activities or describe functional units. |
Nuisance call | Any unsolicited call interaction that consumes contact centre resources. |
Ready state | An agent status that indicates readiness to handle interactions. |
Screen pop | A behaviour causes the automatic opening of an external application when an incoming interaction is received. |
Service Level Agreement (SLA) | A general name for the minimum quality of service required, either guaranteed as a contractual requirement or internally through goal setting. |
Text-to-speech | A solution that allows text inputs to be converted into voice form. |
Speech-to-text | A solution that enables automatic transcription of voice interactions into text form for further analysis and processing. |
Wallboard | A contact centre solution component that displays a comprehensive presentation of current and immediate contact centre operational information, typically displayed on a television screen in the contact centre. |
Workforce Management (WFM) | A discipline dedicated to capacity planning and capacity management in the contact centre. |
Workforce Optimisation (WFO) | A system used to automatically optimise capacity planning based on statistics from previous operational data. |
1.3.1 Service Level Agreement (SLA)
A service level agreement is a general name for the minimum quality of service required, either guaranteed as a contractual requirement or internally through goal setting. Each ticket category and each account can have a different SLA setup, defining how long the contact centre has to send the first response to the customer and to solve incoming tickets in three priority levels: low, medium and high. Only the working hours set up in each ticket category are taken into account when calculating the SLA. When a ticket is created, its deadline is automatically set according to the relevant SLA and working hours.
A list of SLA terms:
Term | Abbreviation | Description |
|---|---|---|
Deadline | DL | The date and time the ticket needs to solved by for the contact centre to meet the SLA |
Ticket creation time | TCT | The time when the ticket was created |
Response time | RT | How long the contact centre has to reply to a ticket to meet the SLA |
Solution time | ST | How long the contact centre has to solve a ticket to meet the SLA |
Time outside working hours | TOWH | Any time that does not fall inside the working hours set up in the ticket category |
When only a Solution time has been set in the SLA, the following formula applies to calculate the SLA deadline:

When both a Solution time and a Response time have been set, the formula for calculating the deadline for the First response is as follows:

As soon as the first response is sent, the deadline formula will automatically be changed to the following:

A first response is defined as any activity in a new ticket that conveys to the customer information about what is being done to solve it. The following activities meet this criterion:
An outgoing email
An SMS, Facebook Messenger, WhatsApp or Viber message
A call that is connected
With the exception of email, a response can also be an incoming activity. E.g. when a customer sends an email, a ticket is created. If they then call and the agent merges the call with the ticket, the call will be counted as a response. Notice that a call that is not connected will not be counted as a response as no information about the ticket is conveyed to the customer.
A ticket is considered as solved when it is closed. If this happens before the deadline calculated using the formulas above, the contact centre has met its SLA.
2. Statistical Metrics
The following text serves as a general description and normalisation of the metrics commonly used in a contact centre. The description mainly uses objects such as interaction (red), activity (blue) and processing (green). For outbound directions, the duration of the customer's connection to the interaction is also indicated (orange). Illustrative examples are used to clarify the description. The following metrics are used in the examples below:
Metric | Abbreviation | Description |
|---|---|---|
Handling Time | HT | The amount of time an agent handles the interaction |
Interaction Duration (Call Duration) | ID (CD) | The length of the interaction. |
Waiting Time | WT | The amount of time the customer was waiting for a connection with an agent during an incoming call. |
Ringing Time | RT | The amount of time the agent or the system waited for a connection with the customer. |
After Interaction Work (After Call Work) | AIW (ACW) | The time after interaction processing when the agent performs operations related to handling the interaction. |
Before Interaction Work (Before Call Work) | BIW (BCW) | The time before interaction processing when the agent performs operations related to handling the interaction. |
Talk Time | TT | The agent's interaction time (time spent handling interactions). |
Interaction Count | CNT | The total number of interactions. |
The following metrics are derived from the basic metrics above and serve as an overview of the abbreviations in the following examples:
Metric | Abbreviation | Description |
|---|---|---|
Average Handling Time | AHT | The average length of interaction handling. |
Total Handling Time | HTTOTAL | The total handling time for all interactions. |
Average Interaction Duration (Average Call Duration) | AID (ACD) | The average duration of interactions. |
Maximum Interaction Duration (Maximum Call Duration) | IDMAX (CDMAX) | The maximum duration of an interaction. |
Total Interaction Duration (Total Call Duration) | IDTOTAL (CDTOTAL) | The total duration of interactions. |
Average Waiting Time | WTAVG | The average time spent waiting for an agent to accept the interaction. |
Maximum Waiting Time | WTMAX | The maximum time spent waiting for an agent to accept the interaction. |
Total Waiting Time | WTTOTAL | The total time spent waiting for an agent to accept interactions. |
2.1. Incoming Interactions
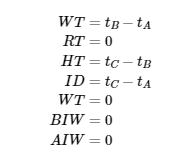
The following is an example of an inbound interaction when the agent doesn't fill in any call information, so there is no reason to display the activity window after the end of the interaction.

Legend: Interaction | Activity | Processing
Point tA = the incoming interaction (call) enters a queue, the interaction object is created.
Point tB = the agent accepts the interaction, the agent activity and the processing are created at the same time.
Point tC = the interaction is ended by the agent or customer, the interaction, activity and the processing end.
In the above example, the following formulas apply to calculate metrics:
2.2. Incoming Interactions With a Form
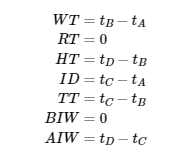
The following is an example of an inbound interaction where the agents fills in a form about the contents of the interaction after it ends.

Legend: Interaction | Activity | Processing
Point tA = the incoming interaction (call) enters a queue, the interaction object is created.
Point tB = the agent accepts the interaction, the agent activity and the processing are created at the same time.
Point tC = the interaction is ended by the agent or customer, the interaction and the processing end.
Point tD = the activity is ended by the agent after they fill in and save the form.
In the above example, the following formulas apply to calculate metrics:
2.3. Incoming Interactions With a Form and Transfer
The following is an example of a situation in the queue where a form is set up and it is therefore necessary to perform operations regarding the interaction even after it ends and at the same time the call is transferred to another agent.
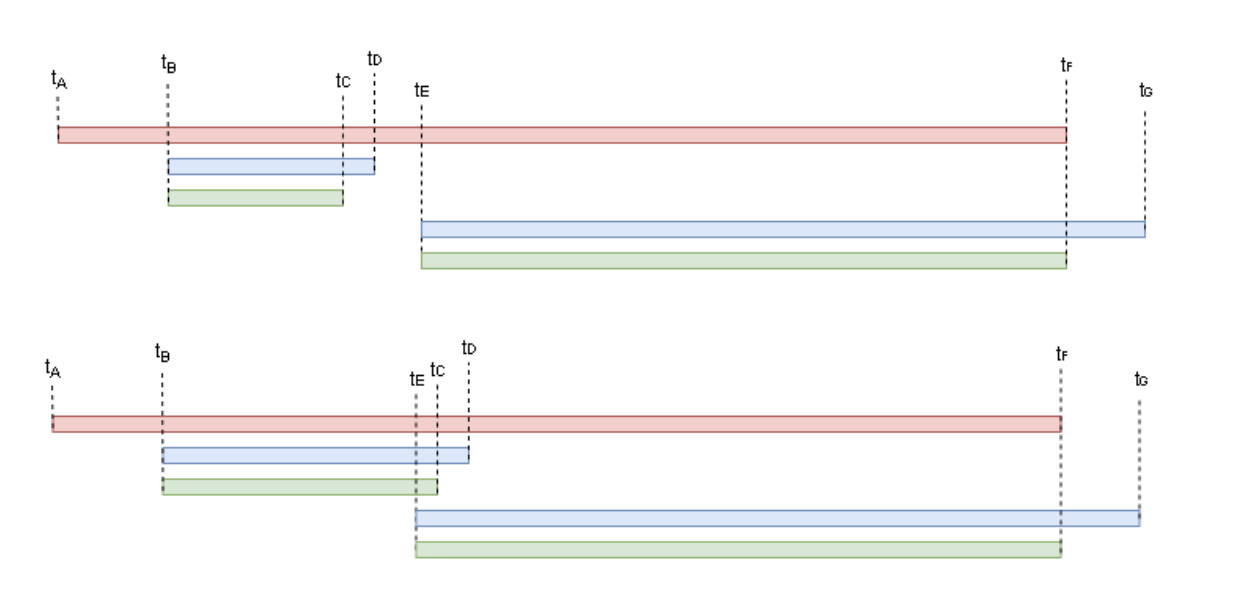
Legend: Interaction | Activity | Processing
Point tA = the incoming interaction (call) enters a queue, the interaction object is created.
Point tB = the agent accepts the interaction, the agent activity and the processing are created at the same time.
Point tC = the interaction is transferred to another agent, the original agent processing ends.
Point tD = the original agent completes activities after finishing the interaction, the original agent activity ends.
Point tE = the new agent joins the interaction, the new agent activity is created.
Point tF = the interaction is ended by the new agent or the customer, the new agent processing and the interaction end.
Point tG = end of the new agent's after interaction work, the new agent activity ends.
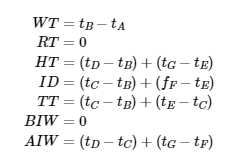
In the above example, the following formulas apply to calculate metrics:
2.4. Outbound Interactions
The following example illustrates an outbound interaction where the agent doesn't fill in any call information.

Legend: Customer's connection | Interaction | Activity | Processing
Point tA = the outgoing interaction (call) is created in the queue, the interaction object, activity and the processing are created.
Point tB = the customer accepts the interaction.
Point tC = the outgoing interaction is ended; the interaction object, activity and processing end.
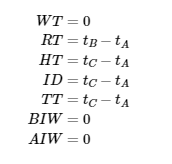
In the above example, the following formulas apply to calculate metrics:
2.5. Outbound Interactions With a Form
The following is an example of an outbound interaction where the agent views the customer information before the interaction and fills new data into the form after finishing the interaction.

Legend: Customer's connection | Interaction | Activity | Processing
Point tA = the agent loads a record, the activity is created.
Point tB = the agent initiates the interaction, the interaction object and the processing are created.
Point tC = the customer accepts the interaction.
Point tD = the interaction is ended by the agent or customer, the interaction object and the processing end.
Point tE = the end of the agent's after interaction work, the agent activity ends.
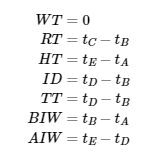
In the above example, the following formulas apply to calculate metrics:
2.6. Outbound Interaction With a Predictive Dialler
The following is an example of an outbound interaction which is initiated by a predictive dialler. The outbound interaction is then connected with the customer and allocated to an available agent.

Legend: Customer's connection | Interaction | Activity | Processing
Point tA = the interaction is initiated by a predictive dialler, the interaction object is created.
Point tB = the customer accepts the interaction.
Point tC = the agent accepts the interaction, the agent activity and the processing are created.
Point tD = the interaction is ended by the agent or customer; the activity and the processing end.
Point tE = the end of the agent's after interaction work, the agent activity ends.
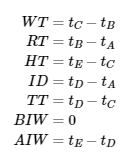
In the above example, the following formulas apply to calculate metrics:
2.7. Aggregation Functions
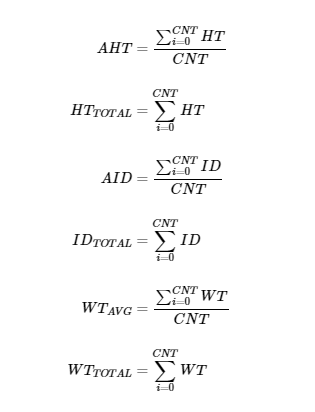
The following is an example of how to calculate aggregate metrics:
2.8. Service Level and Occupancy
There are two basic metrics for capacity planning management:
Service Level – the ability for the contact centre to handle the many interactions that are directed to the contact centre. The basic parameter for the metric is Service Level Threshold which indicates the maximum number of seconds a caller can wait in a queue before being connected to an agent. The parameter Abandon Threshold is sometimes used with this metric. It indicates the number of seconds from queue entry, basically meaning extra short calls that the call centre didn't have a change to answer. In some cases however, these calls don't affect metric calculation, so the parameter is only reported as an absolute value. Service level is defined as the percentage of calls answered within a predetermined number of seconds. For example, if the service level is 80/20, then the contact centre are must answer 80% of all interactions within 20 seconds from queue entry.
Occupancy – the current occupancy of contact center agents.
Both metrics are expressed as percentages and are closely related. Using their values, you can quickly estimate errors in capacity planning in a contact centre and adapt operations accordingly. Typically, the two metrics are inversely proportional, that is as one metric decreases, the other increases and vice versa. There are however cases where this relationship doesn't apply, meaning you can sometimes determine the traffic type that the contact centre handles. Hypothetically, ideal values are 100% Service Level and 100% Occupancy, but this is completely unreachable in practice, firstly because of the relationship between the two metrics and secondly because of the financial cost as pushing SL above 90-95% is not cost effective.
The following table provides an approximate interpretation of the metric values:
Service Level | Occupancy | Interpretation |
|---|---|---|
Increases | Decreases | The contact centre handles incoming interactions better and better so agents are getting less busy. |
Decreases | Increases | The contact centre handles incoming interactions worse and worse so agents are getting more busy. |
Increases | Increases | The contact centre handles incoming interactions better and better but at the same time agents are getting more and more busy. This indicates you are getting close to the ideal capacity plan. |
Decreases | Decreases | The contact centre handles incoming interactions worse and worse but at the same time agents are getting less and less busy. This indicates a burst of incoming traffic when interactions come to the contact centre in waves: all agents are fully occupied at one moment, but as a consequence, interactions stop coming in, so the agents stop being busy. |
The following input data is used to calculate metrics:
Metric | Abbreviation | Description |
|---|---|---|
Interactions count | CNT | The total number of interactions that are routed to the contact centre. |
Interactions answered | ANSWR | The total number of answered interactions. |
Interactions answered within Service Level Threshold | ANSWRSLT | The total number of answered interactions that were waiting for an agent connections less than the Service Level Threshold time. |
Interactions abandoned | ABN | The total number of interactions that were abandoned. |
Interactions abandoned within Abandon Threshold | ABNAT | The total number of abandoned interactions that were waiting for connections less than the Abandon Threshold time. |
Interactions abandoned within Service Level Threshold after Abandon Threshold | ABNSLT | The total number of abandoned interactions that were waiting for connections less than the Service Level Threshold time but more than Abandon Threshold time. |
Agents count | AGNTS | The total number of agents that were in the Ready State during the reporting period. |
Idle time | tIDLE | Time during which the agent isn't actively handling any activities. |
Ready time | tREADY | Time during which the agent is able to actively handle activities. |
There are several theoretical options for calculating Service Level metrics and each has some disadvantages.
The following metric calculation is based on the assumption that interactions without agent pickup where the customer hung up before the Service Level Threshold time don't affect the entire metric at all:

The same result can be achieved by reformulating the equation to the following form:

The following calculation variant considers interactions without agent pickup with a time shorter than the Service Level Threshold as interactions that were picked up by the agent, so they have a positive impact on the metric:

The same result can be achieved by reformulating the equation to the following form:

The total Service Level without the influence of the Service Level Threshold parameter can be calculated by the following equation:

The relationship between Total Service Level and Service Level with the influence of the Service Level Threshold Parameter indicates how patient customers are when waiting to be connected with a contact centre agent and can be the basis for potential implementation of callbacks for the given skill.
The following formula applies for the Occupancy calculation:

In multichannel / omnichannel solutions, theoretically, the formula for calculating occupancy can be customised as the ratio of the total duration of the agent's activities to the maximum achievable duration of the agent's activities. In practice however, it is very difficult to determine the appropriate combination of the distribution matrix to calculate the maximum achievable duration of activities. The benefits of such a calculation are also quite uncertain.
2.9. Customer Satisfaction
In Contact Centre operations, two basic metrics are used to measure Customer Satisfaction. These are Customer Satisfaction (CSAT) and Net Promoter Score (NPS). CSAT is a key metric for measuring customer satisfaction with the provision of а service, а product or in general, for example, with support. NPS (Net Promoter Score) is a metric for measuring customer loyalty to a company or service.
The difference between CSAT and NPS is best illustrated by the way we ask the customer questions when measuring:
"How satisfied were you with the service?" or "How would you rate your overall satisfaction with the provided phone support for the product you purchased?" are questions used to measure CSAT
"How likely are you to recommend the service to friends?" is a question used to measure NPS.
The CSAT metric uses a narrow scale, usually with several options (e.g. 5) used to measure customer satisfaction. These options directly determine how satisfied the customer was with the service. The goal of the CSAT score is to measure the immediate reaction to a specific interaction, product or event. CSAT doesn't however describe the long-term relationship between the customer and the company. When measuring CSAT, it is first determined which choices define a satisfied customer, and then their share of the entirety of collected data will be calculated. In general, the calculation looks like this.

The following variables are defined in the above formula:
CNTCSAT+ is the number of ratings that can be tagged as satisfied customers.
CNTCSAT is the number of all ratings received.
For example, for options 1-5 (1 = very dissatisfied, 2 = dissatisfied, 3 = neutral, 4 = satisfied, 5 = very satisfied), the calculation looks like this:

The NPS metric is much more specific in terms of scale definition. The rating always ranges from 0 to 10 and the with the following score groups:
9-10 are called Promoters – delighted long-term customers loyal to the service, product or company.
7-8 are called Passive – satisfied customers without much enthusiasm for the service, product or company.
0-6 are called Detractors – dissatisfied or an unhappy customers who may share their negative experience with others.
The formula for calculating the NPS metric is as follows:

The following variables are defined in the above formula:
CNTPROM is the number of ratings that falls under the Promoters category
CNTDET is the number of ratings that falls under the Detractors category
CNT is the number of all ratings received
When evaluating a customer's interactions with a contact centre, CSAT metrics analysis is usually done through automatic interaction with a certain delay. It may be for example:
An automated evaluation call initiated after a certain time after a call ends.
An automated evaluation call initiated after a certain time after Case Closing (order, service request, etc.).
Automated call routing to an IVR after а call ends.
An automated SMS with ratings sent after a certain time after а call ends.
An automated email sent after a certain time after Case Closing (order, service request, etc.).
Displaying a rating scale after а web chat ends.
Displaying a rating scale in the footer of an email.
An NPS rating can also be offered immediately after finishing аn interaction or Case Closing, however the long-term purpose should be taken into account when creating your NPS. It is therefore typically implemented, for example, as a supplement to the CSAT metric.
